
The topline
Democrats lead both of Ohio's marquee races in On Point Polling's final October survey, but both leads sit inside the margin of error. Sherrod Brown leads Jon Husted by 4.3 points for U.S. Senate, and Amy Acton leads Vivek Ramaswamy by 4.8 points for governor among likely voters.
U.S. Senate, likely voters
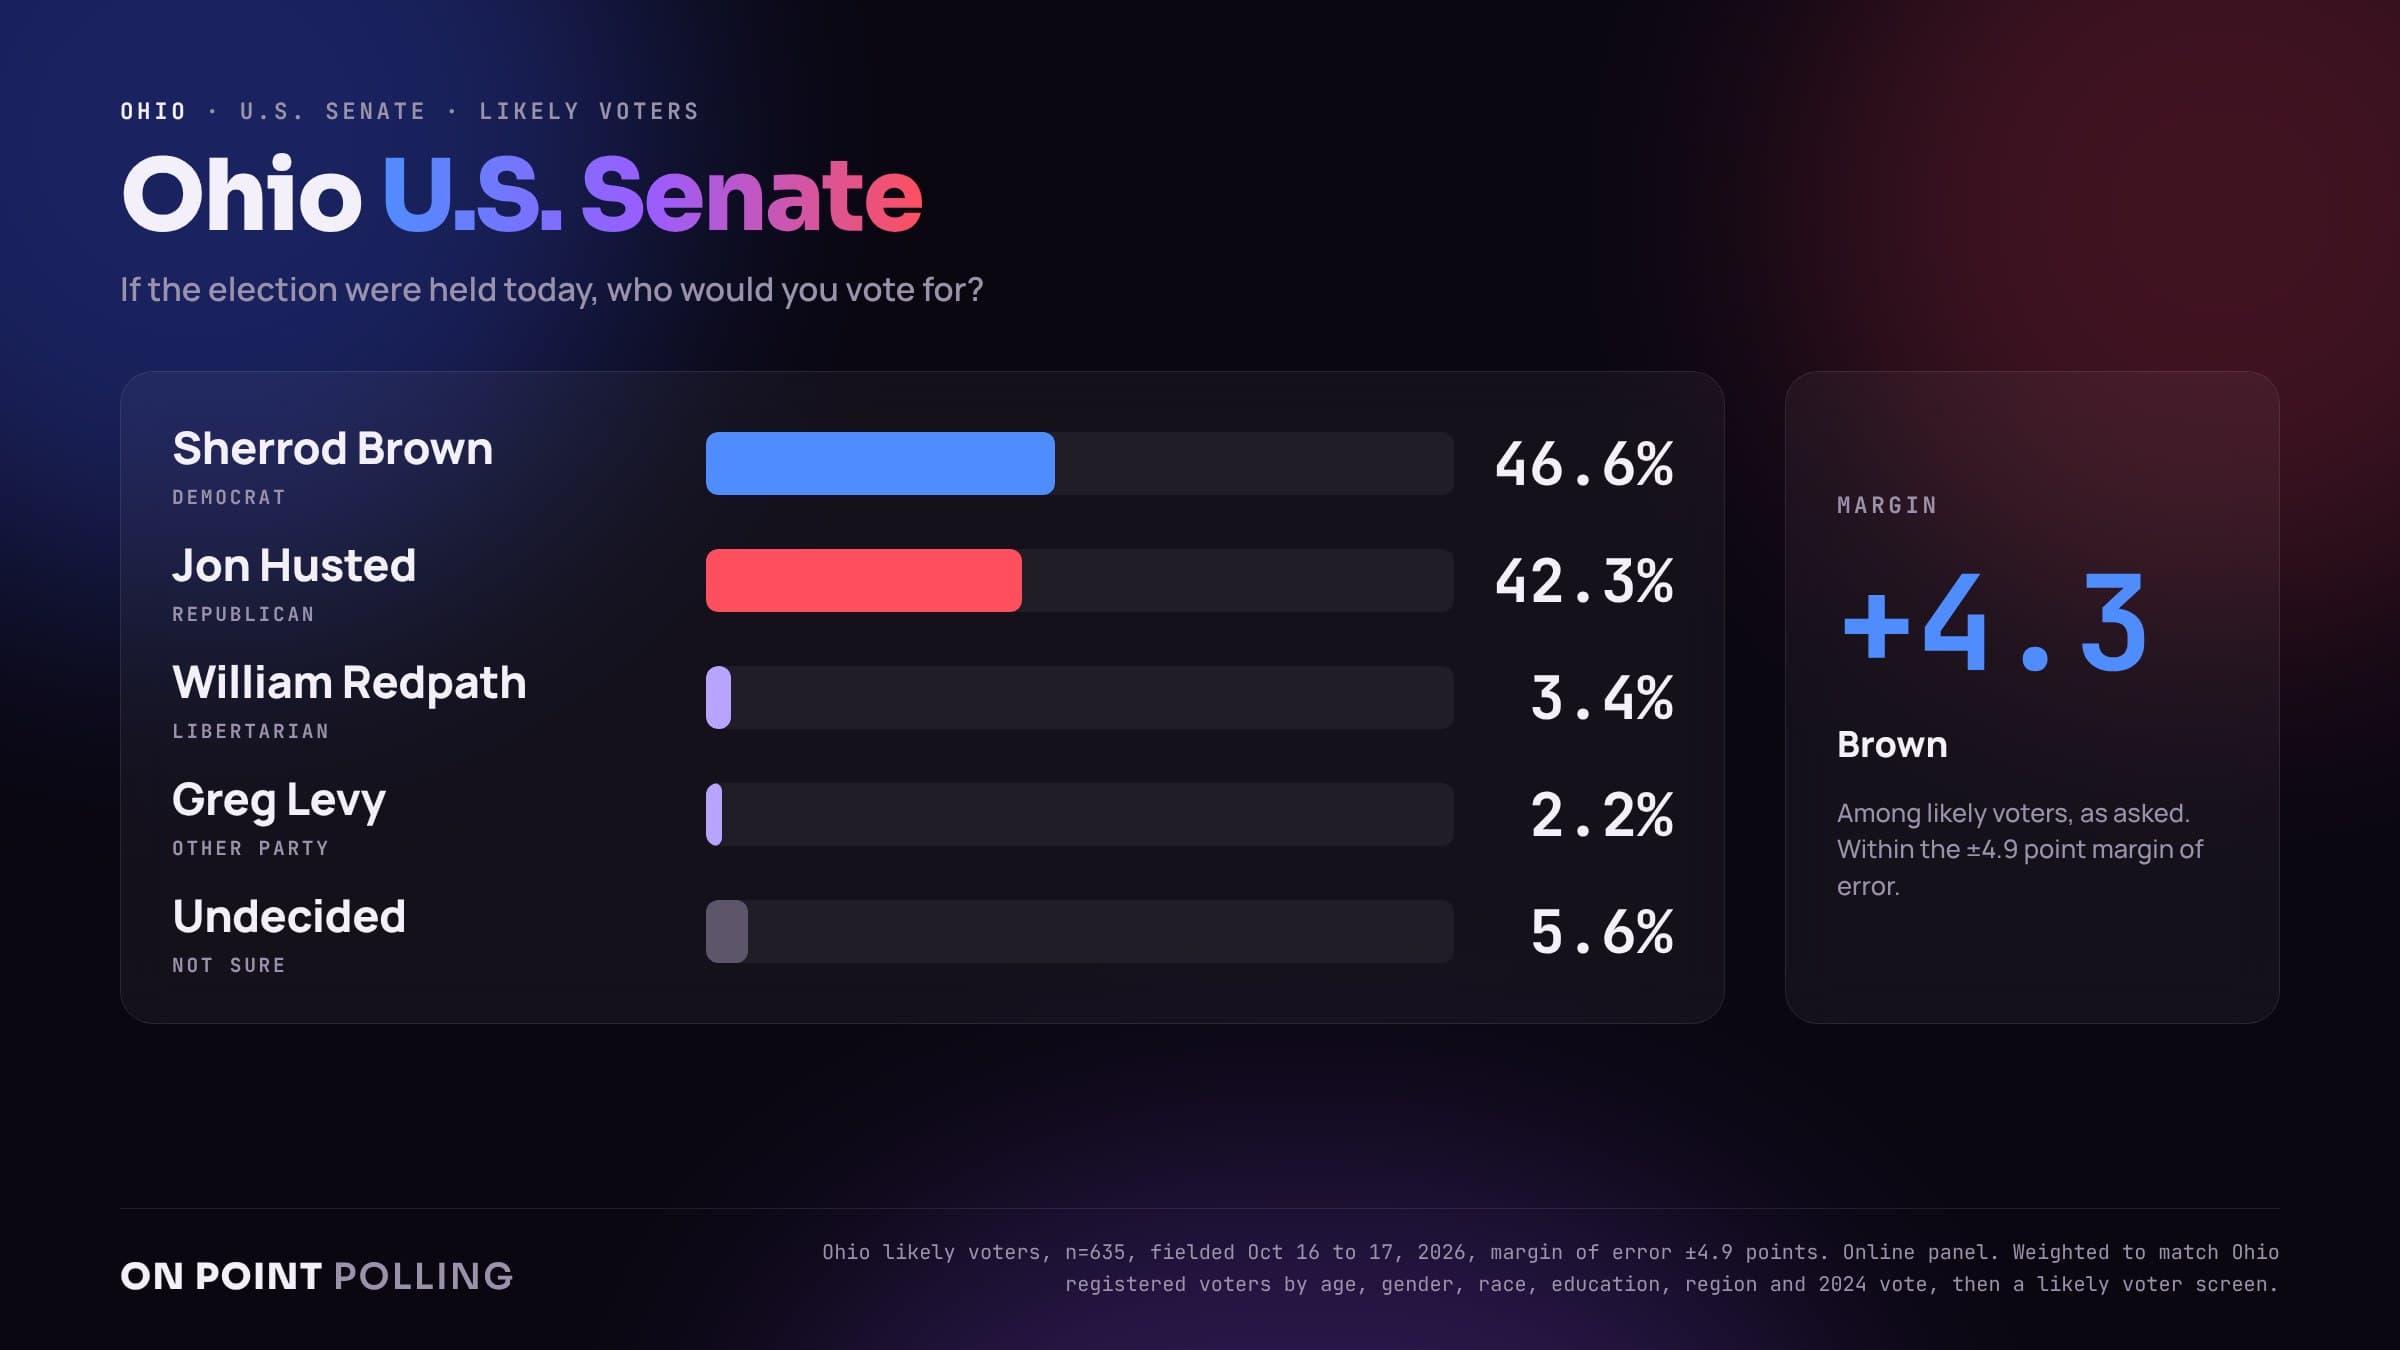
- As asked: Brown 46.6%, Husted 42.3%, Redpath 3.4%, Levy 2.2%, undecided 5.6%. Brown +4.3
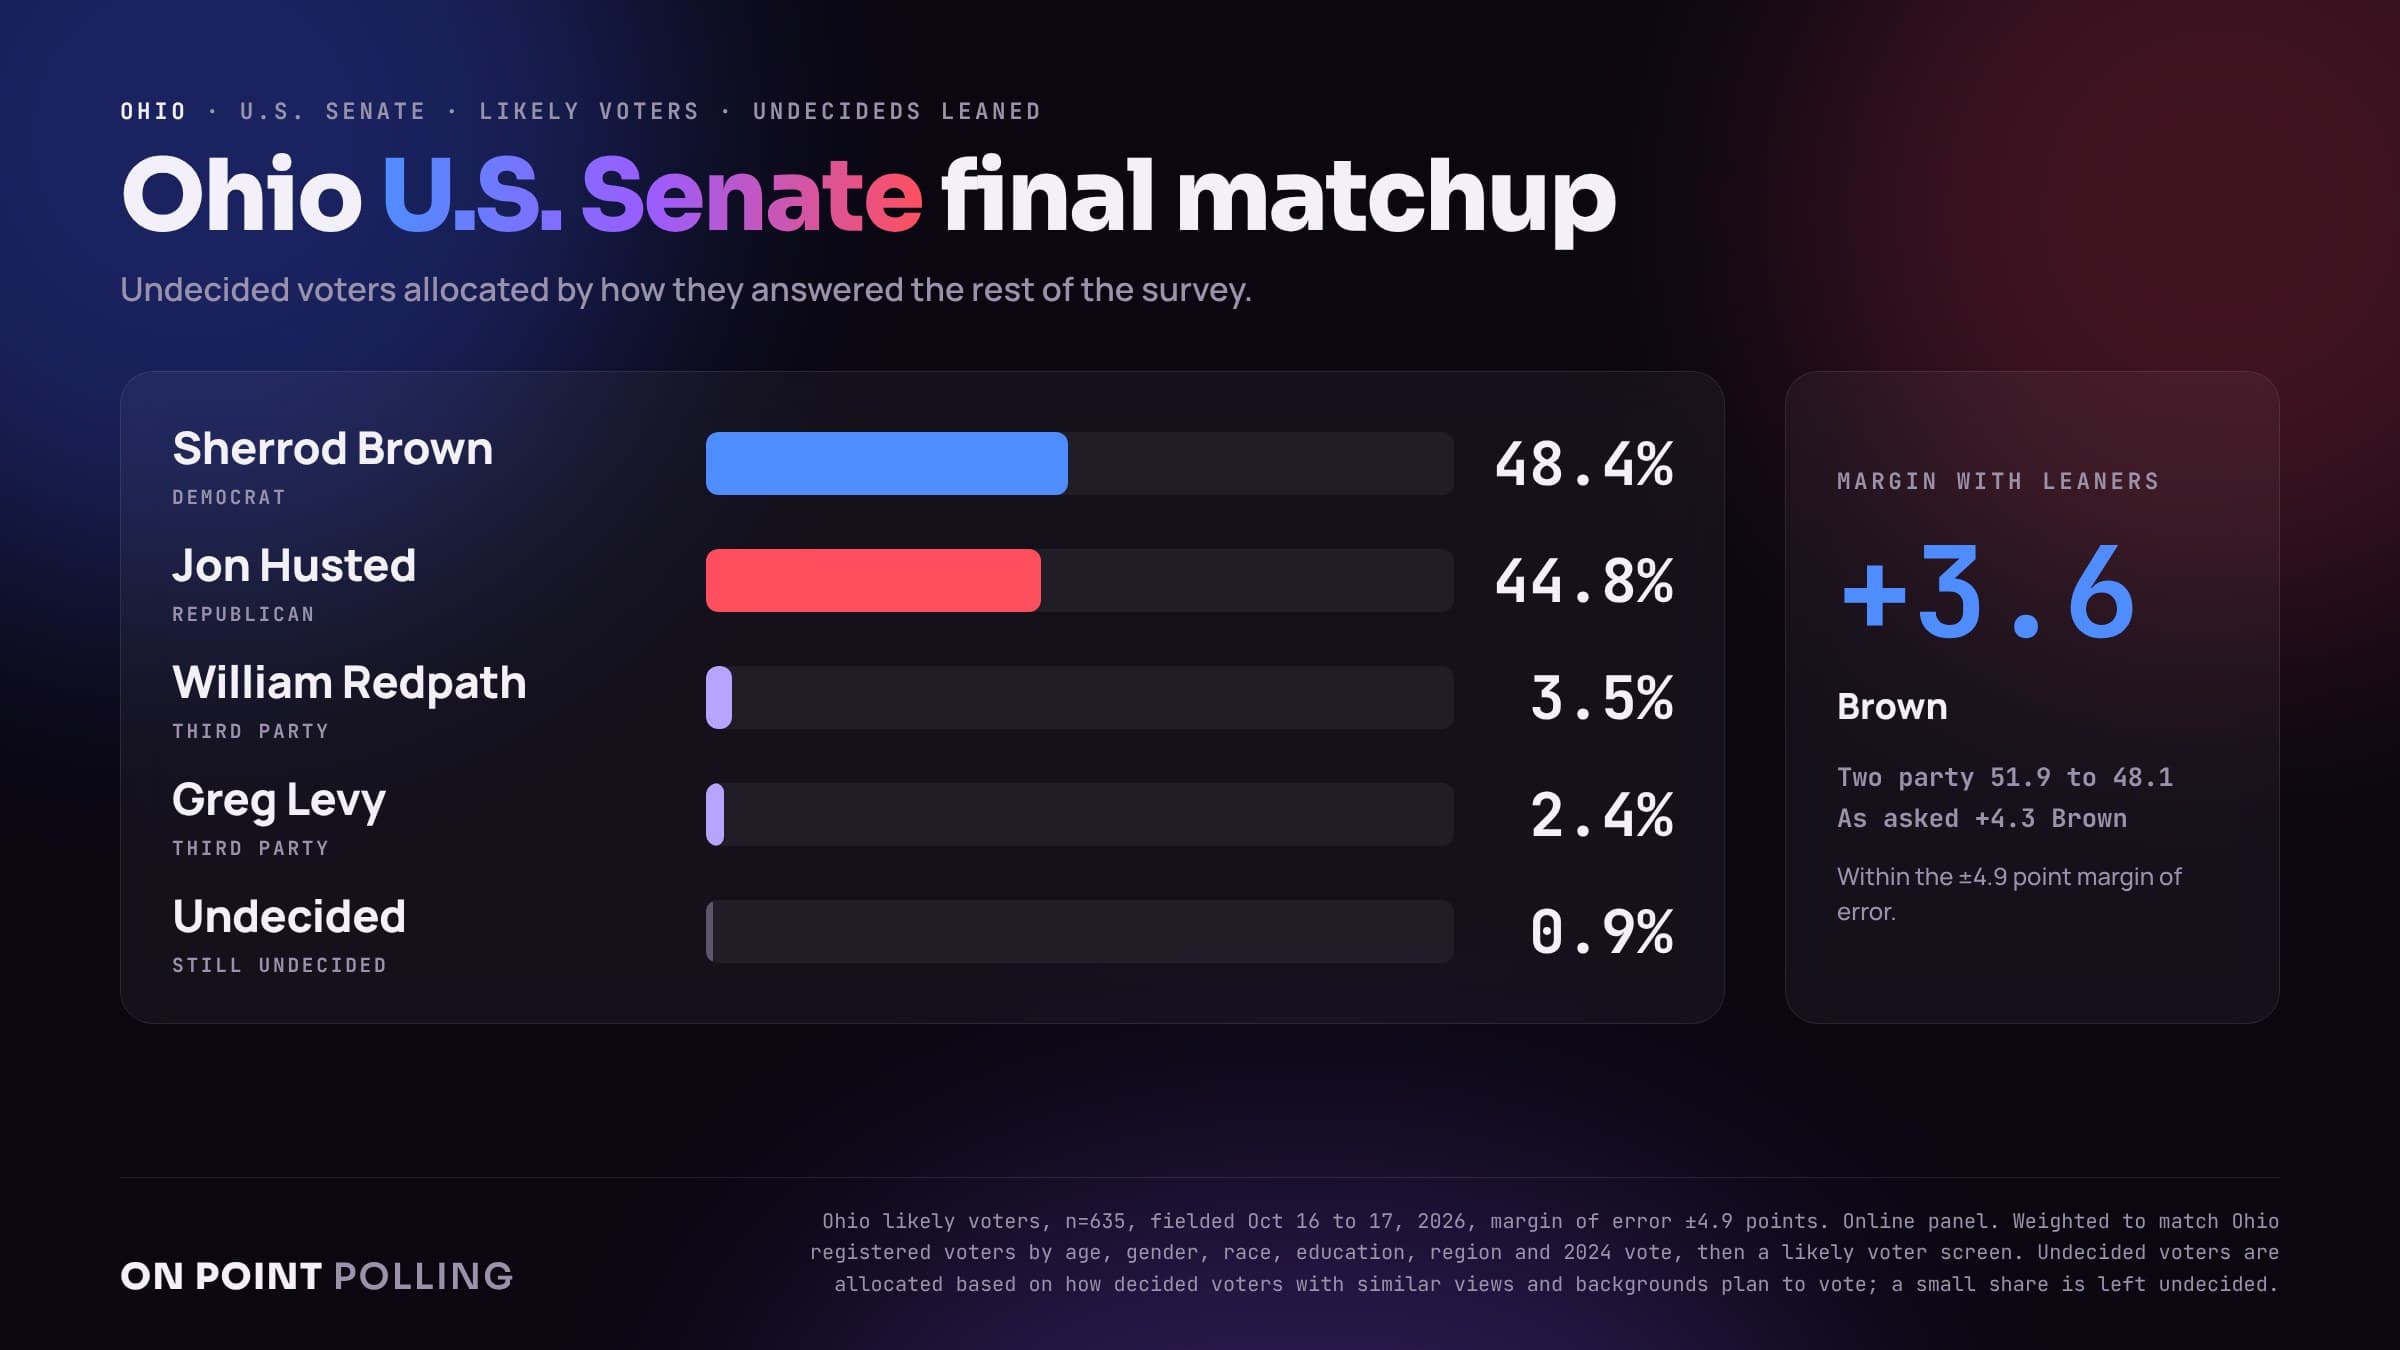
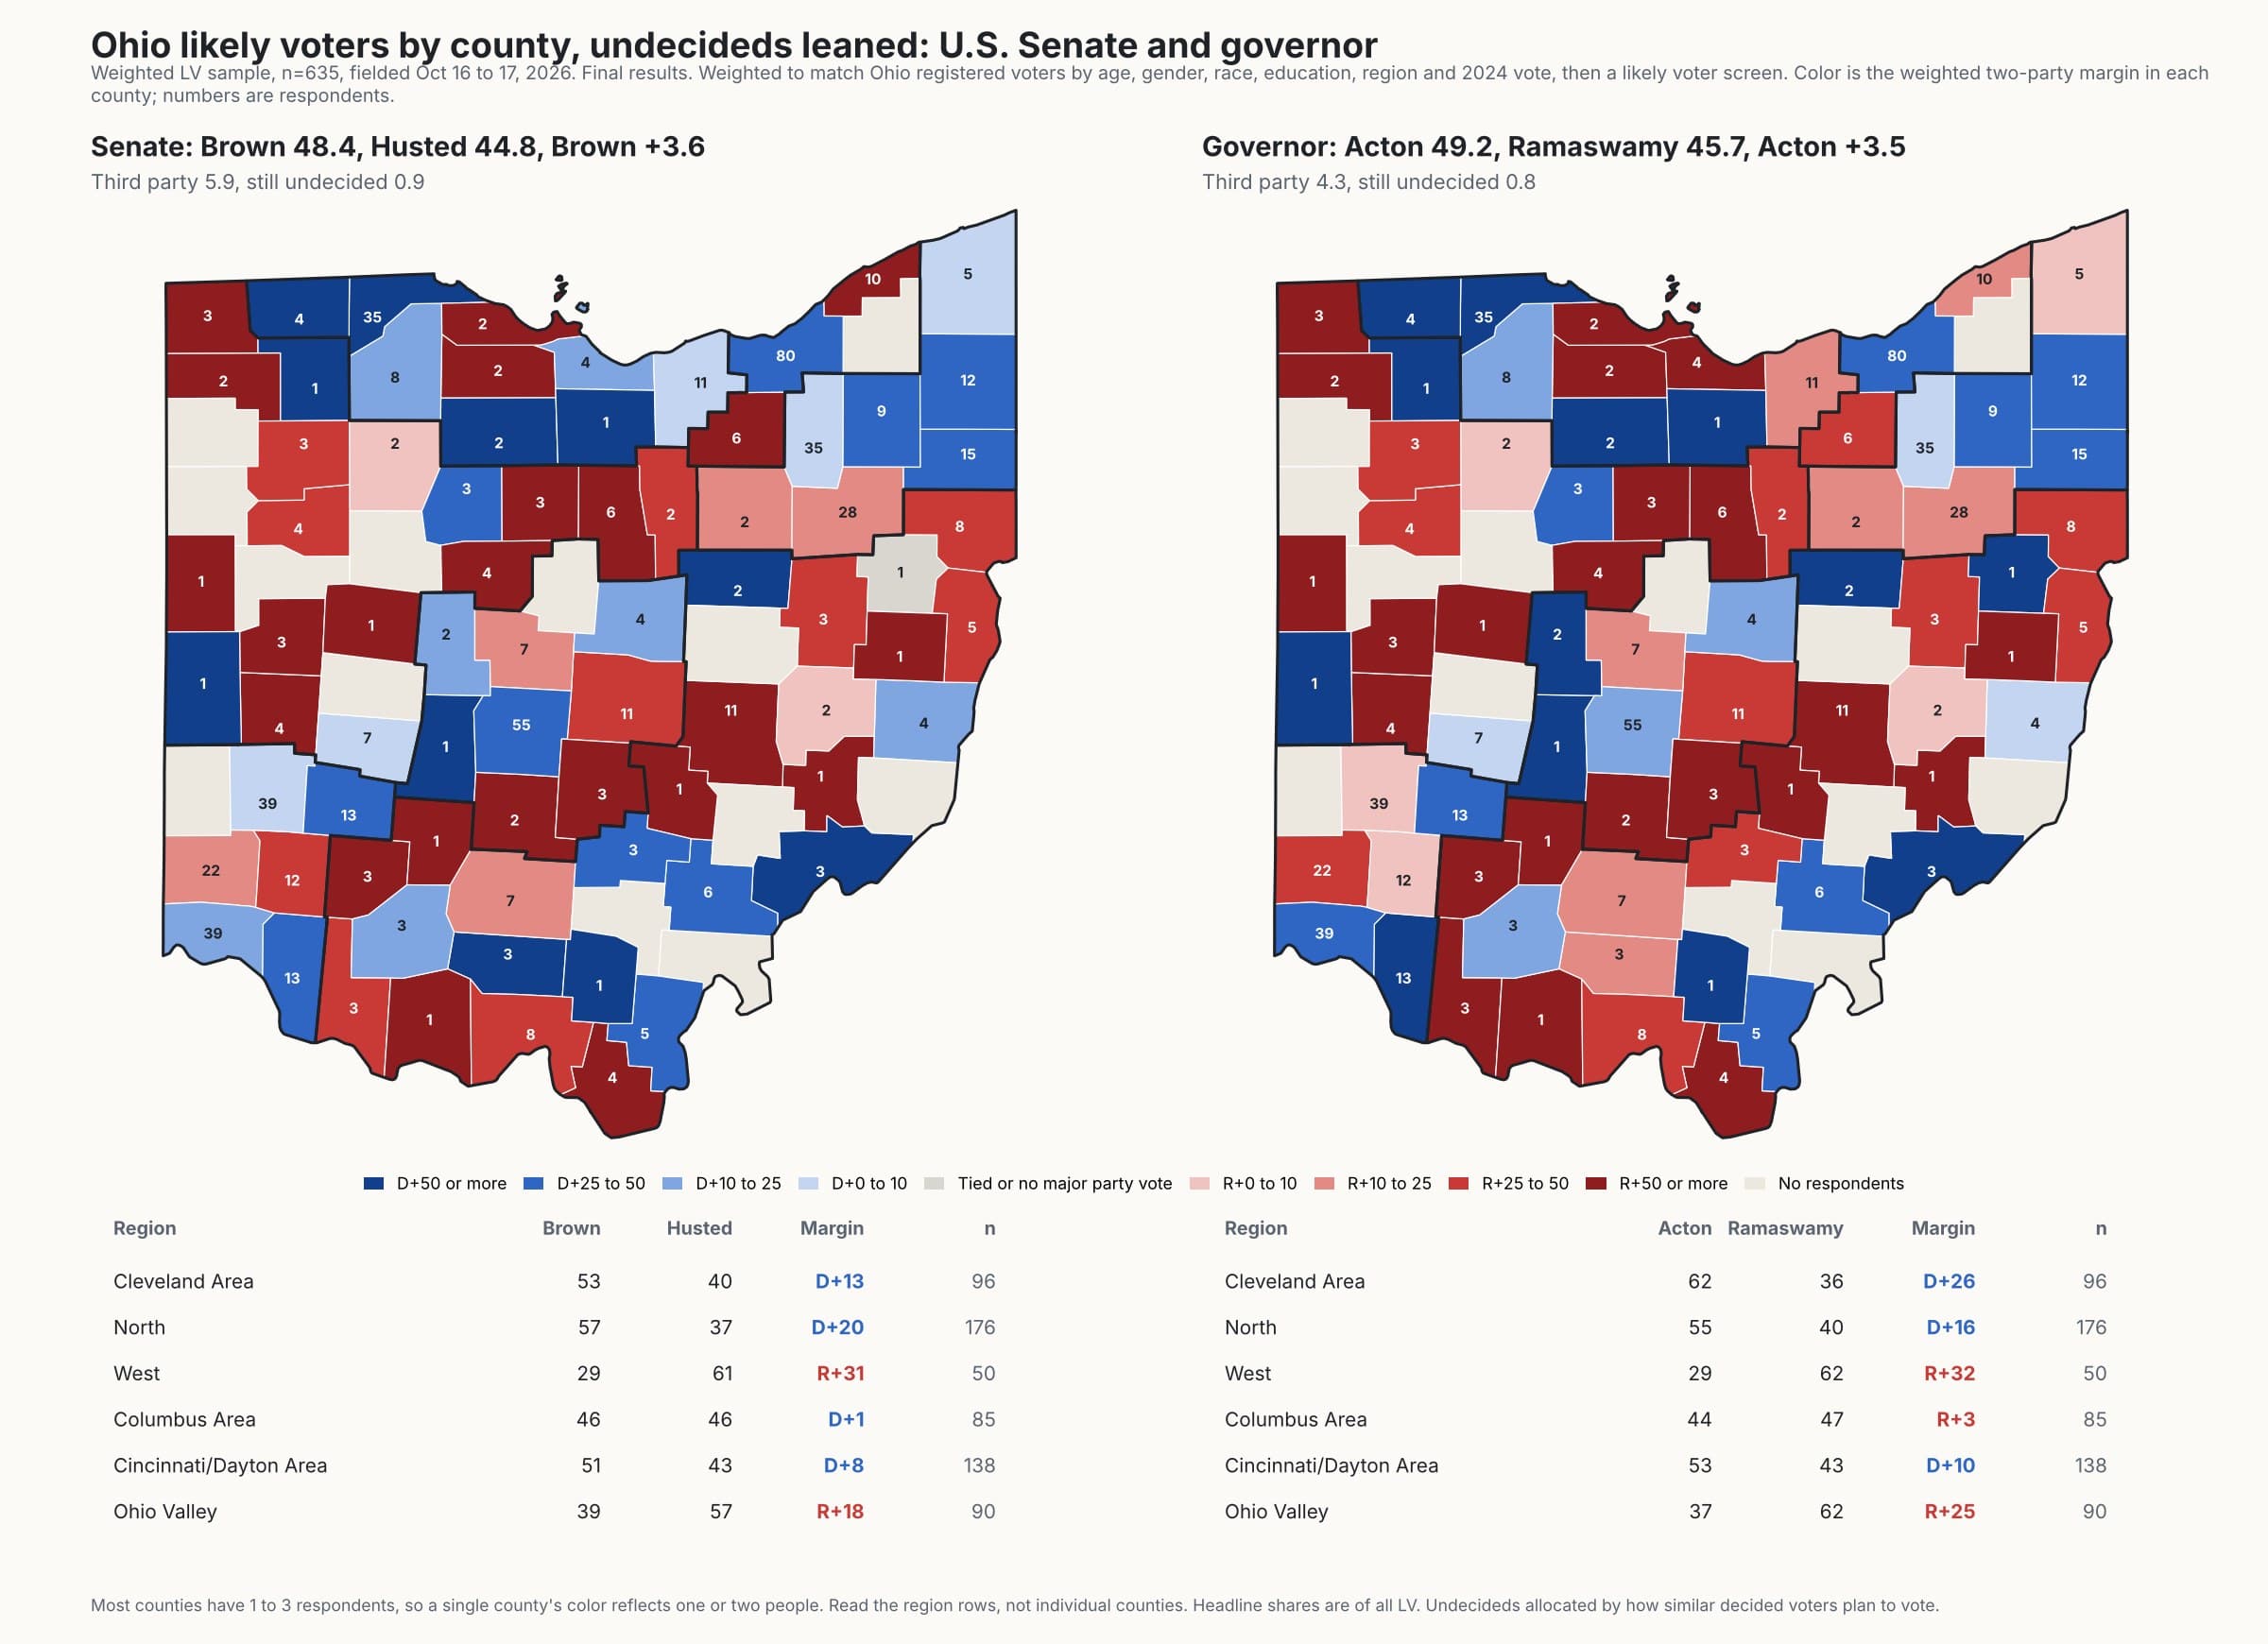
- Undecideds leaned: Brown 48.4%, Husted 44.8%, Redpath 3.5%, Levy 2.4%, undecided 0.9%. Brown +3.6
Governor, likely voters
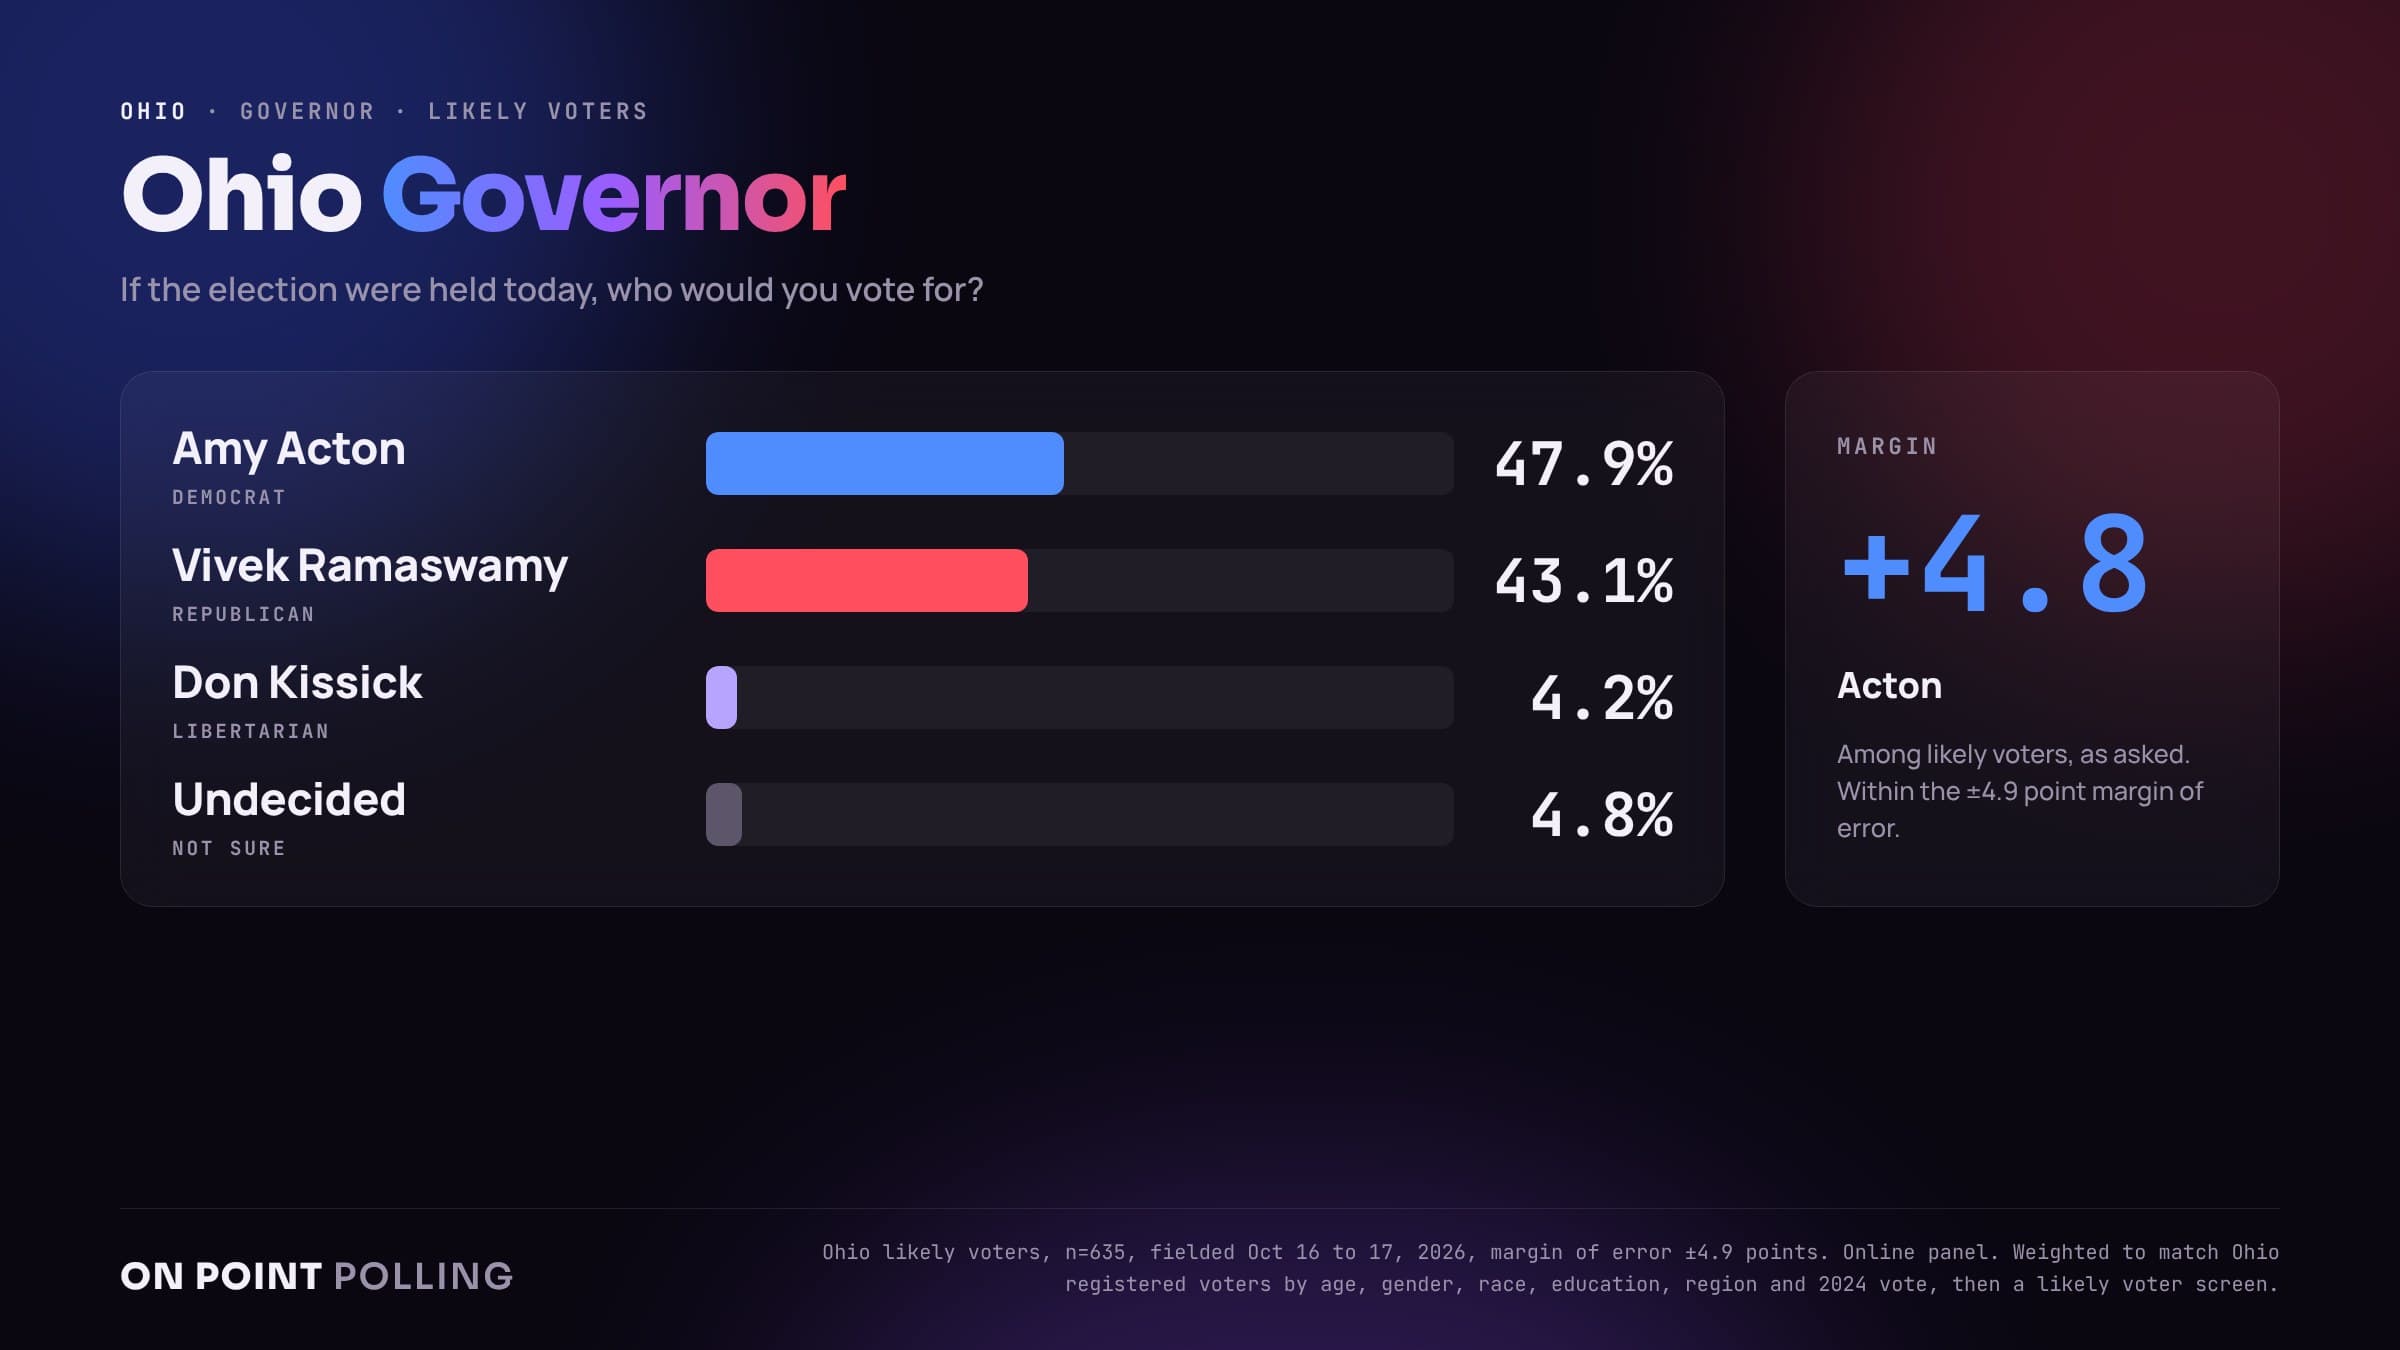
- As asked: Acton 47.9%, Ramaswamy 43.1%, Kissick 4.2%, undecided 4.8%. Acton +4.8
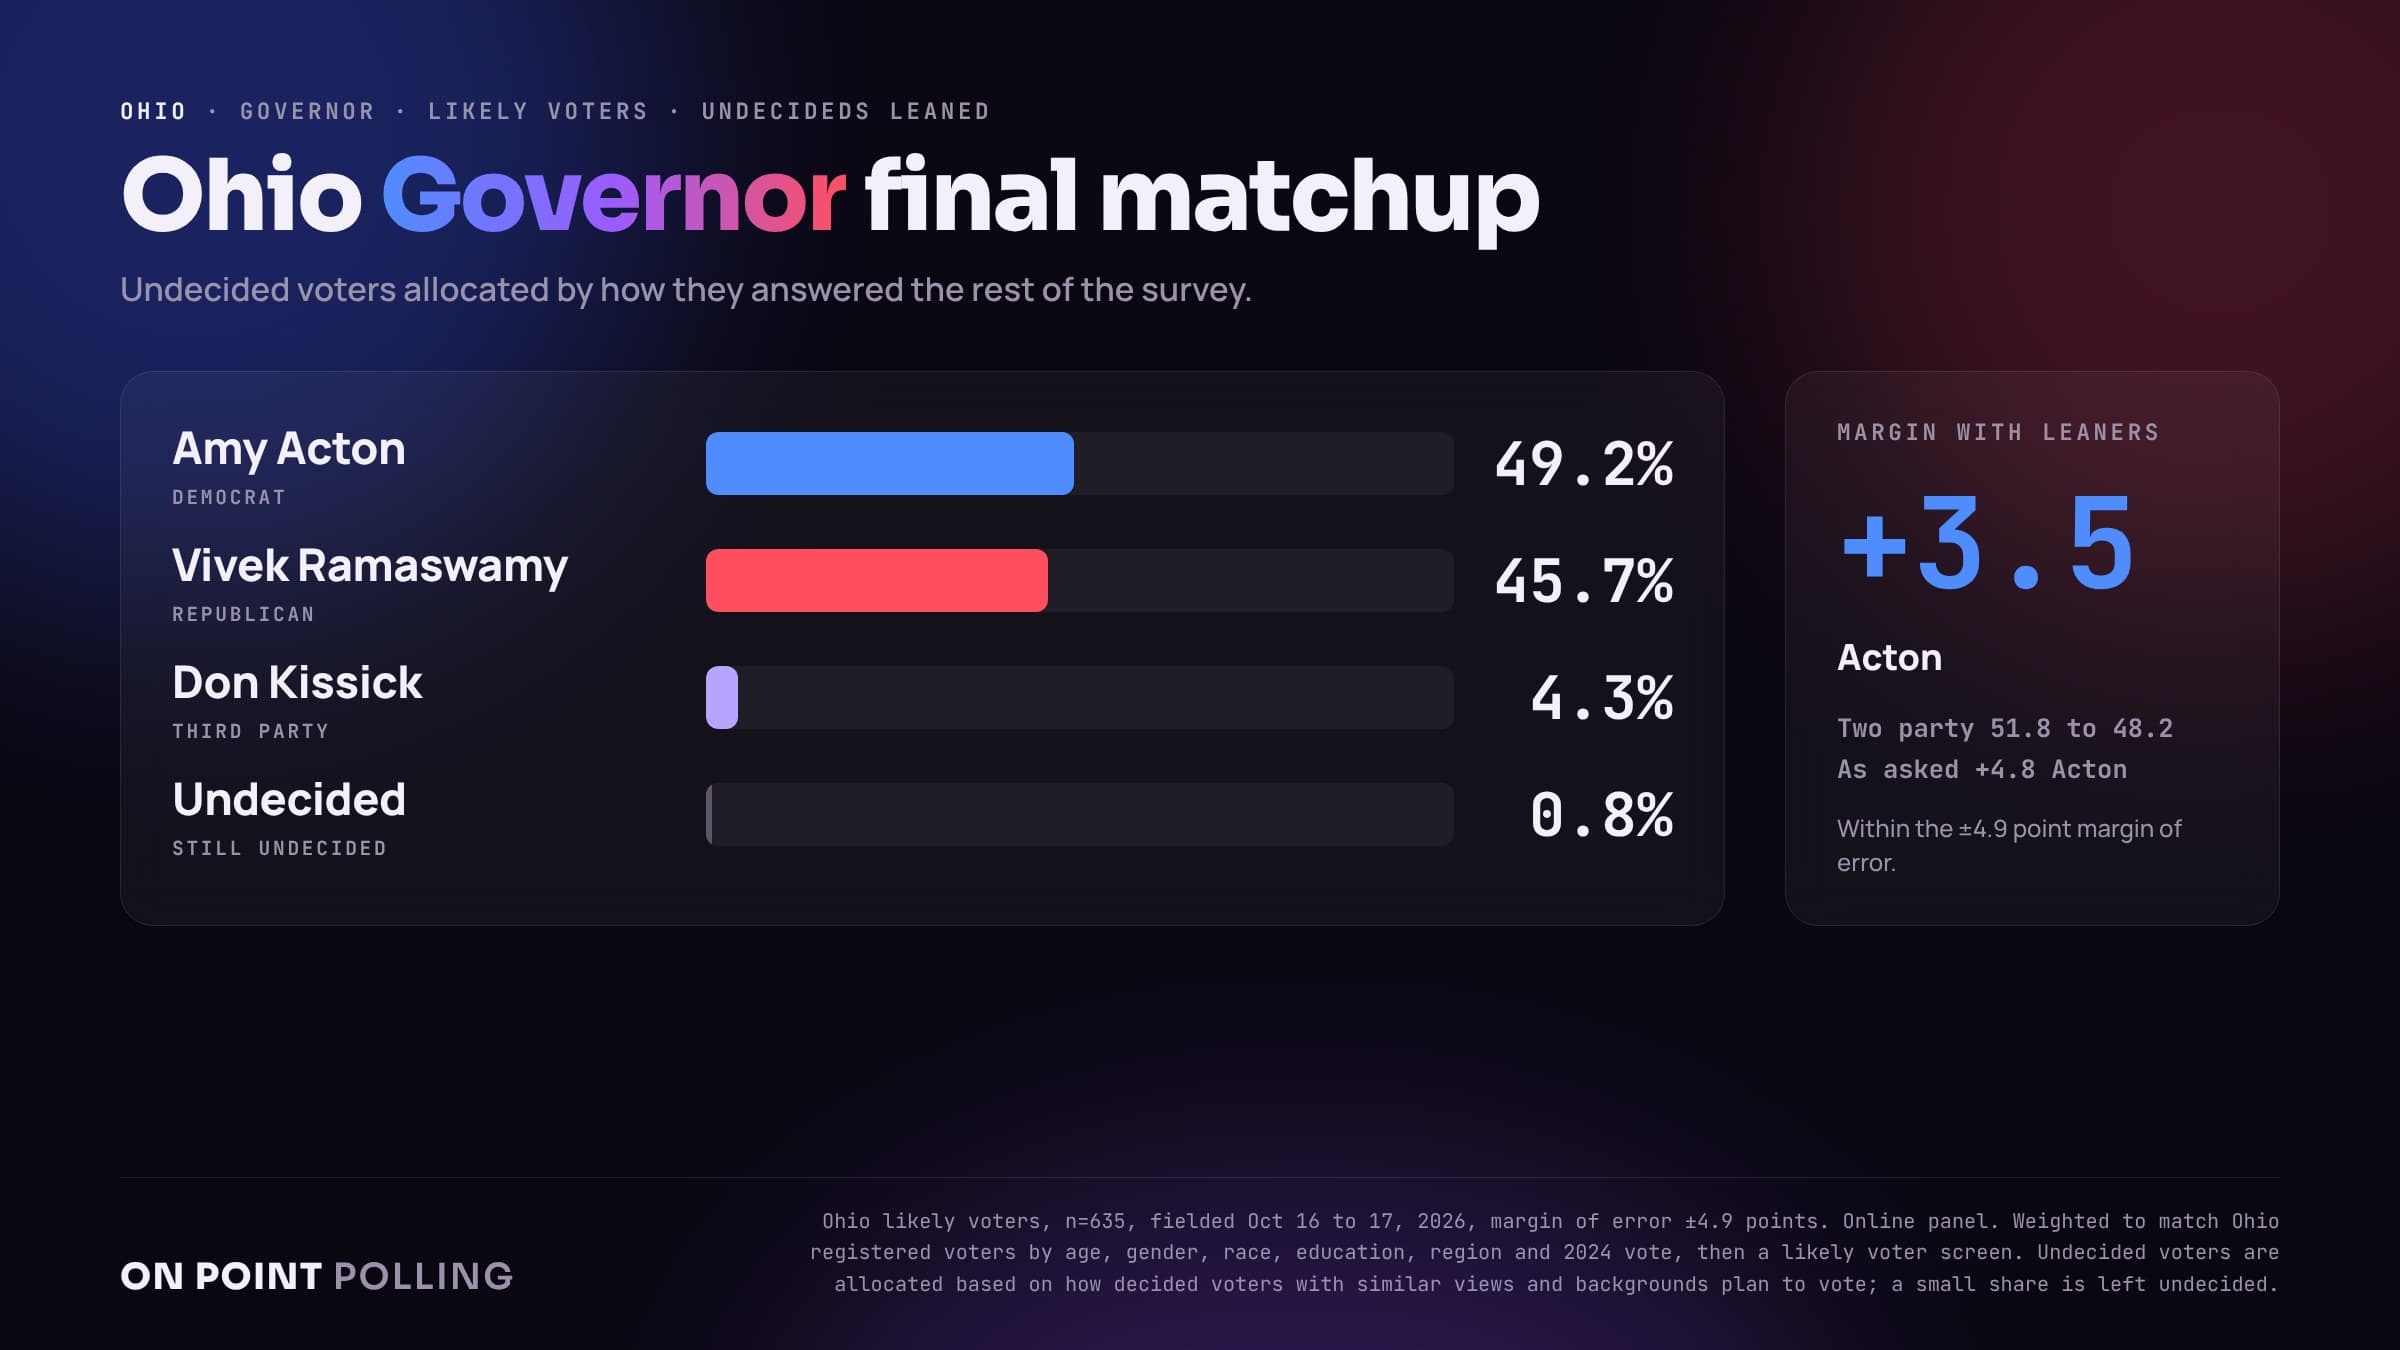
- Undecideds leaned: Acton 49.2%, Ramaswamy 45.7%, Kissick 4.3%, undecided 0.8%. Acton +3.5
We surveyed 635 Ohio likely voters online from October 16 to 17, 2026. The margin of error is ±4.9 points for likely voters.
The short version: this is a close race in a state Donald Trump won by 11 points, and the Democrats are ahead because they are winning independents, drawing more crossover votes and banking a big lead among Ohioans who have already voted.
Senate: Brown holds a narrow edge
Brown leads Husted 46.6% to 42.3% as asked. When we allocate the 5.6% who are undecided, they break 58 to 42 toward Husted, which trims Brown's lead to 3.6 points but does not erase it.
Brown's coalition rests on three pillars:
- Women. Brown wins women 50% to 38%, while Husted carries men 47% to 43%.
- Independents. Brown leads independents 49% to 27%, a 22 point margin.
- Crossover. 8% of 2024 Trump voters back Brown, while only 3% of Harris voters back Husted.
Husted's strength is where Republicans are always strong: he leads white voters without a college degree 49% to 39% and wins rural Ohio by 14 points.
The youngest voters are the least settled. Brown leads voters under 30 by 46% to 21%, but a quarter of them are still undecided.
Among all registered voters, Brown's lead grows to 6.8 points. The likely voter screen narrows the race, as it usually does for Democrats in Ohio.
Governor: Acton leads, Ramaswamy has more room to grow
Acton leads Ramaswamy 47.9% to 43.1% as asked. The governor's race has the sharpest undecided break in the poll: undecided voters lean 67 to 33 toward Ramaswamy, mostly because of how they rate Acton, Ramaswamy and Trump. With them allocated, Acton still leads by 3.5 points.
- The gender gap is wider here. Acton wins women 54% to 37%, while Ramaswamy wins men 49% to 42%.
- Independents favor Acton 48% to 30%.
- Crossover runs her way. 12% of Trump voters back Acton, more than back Brown, while 5% of Harris voters back Ramaswamy.
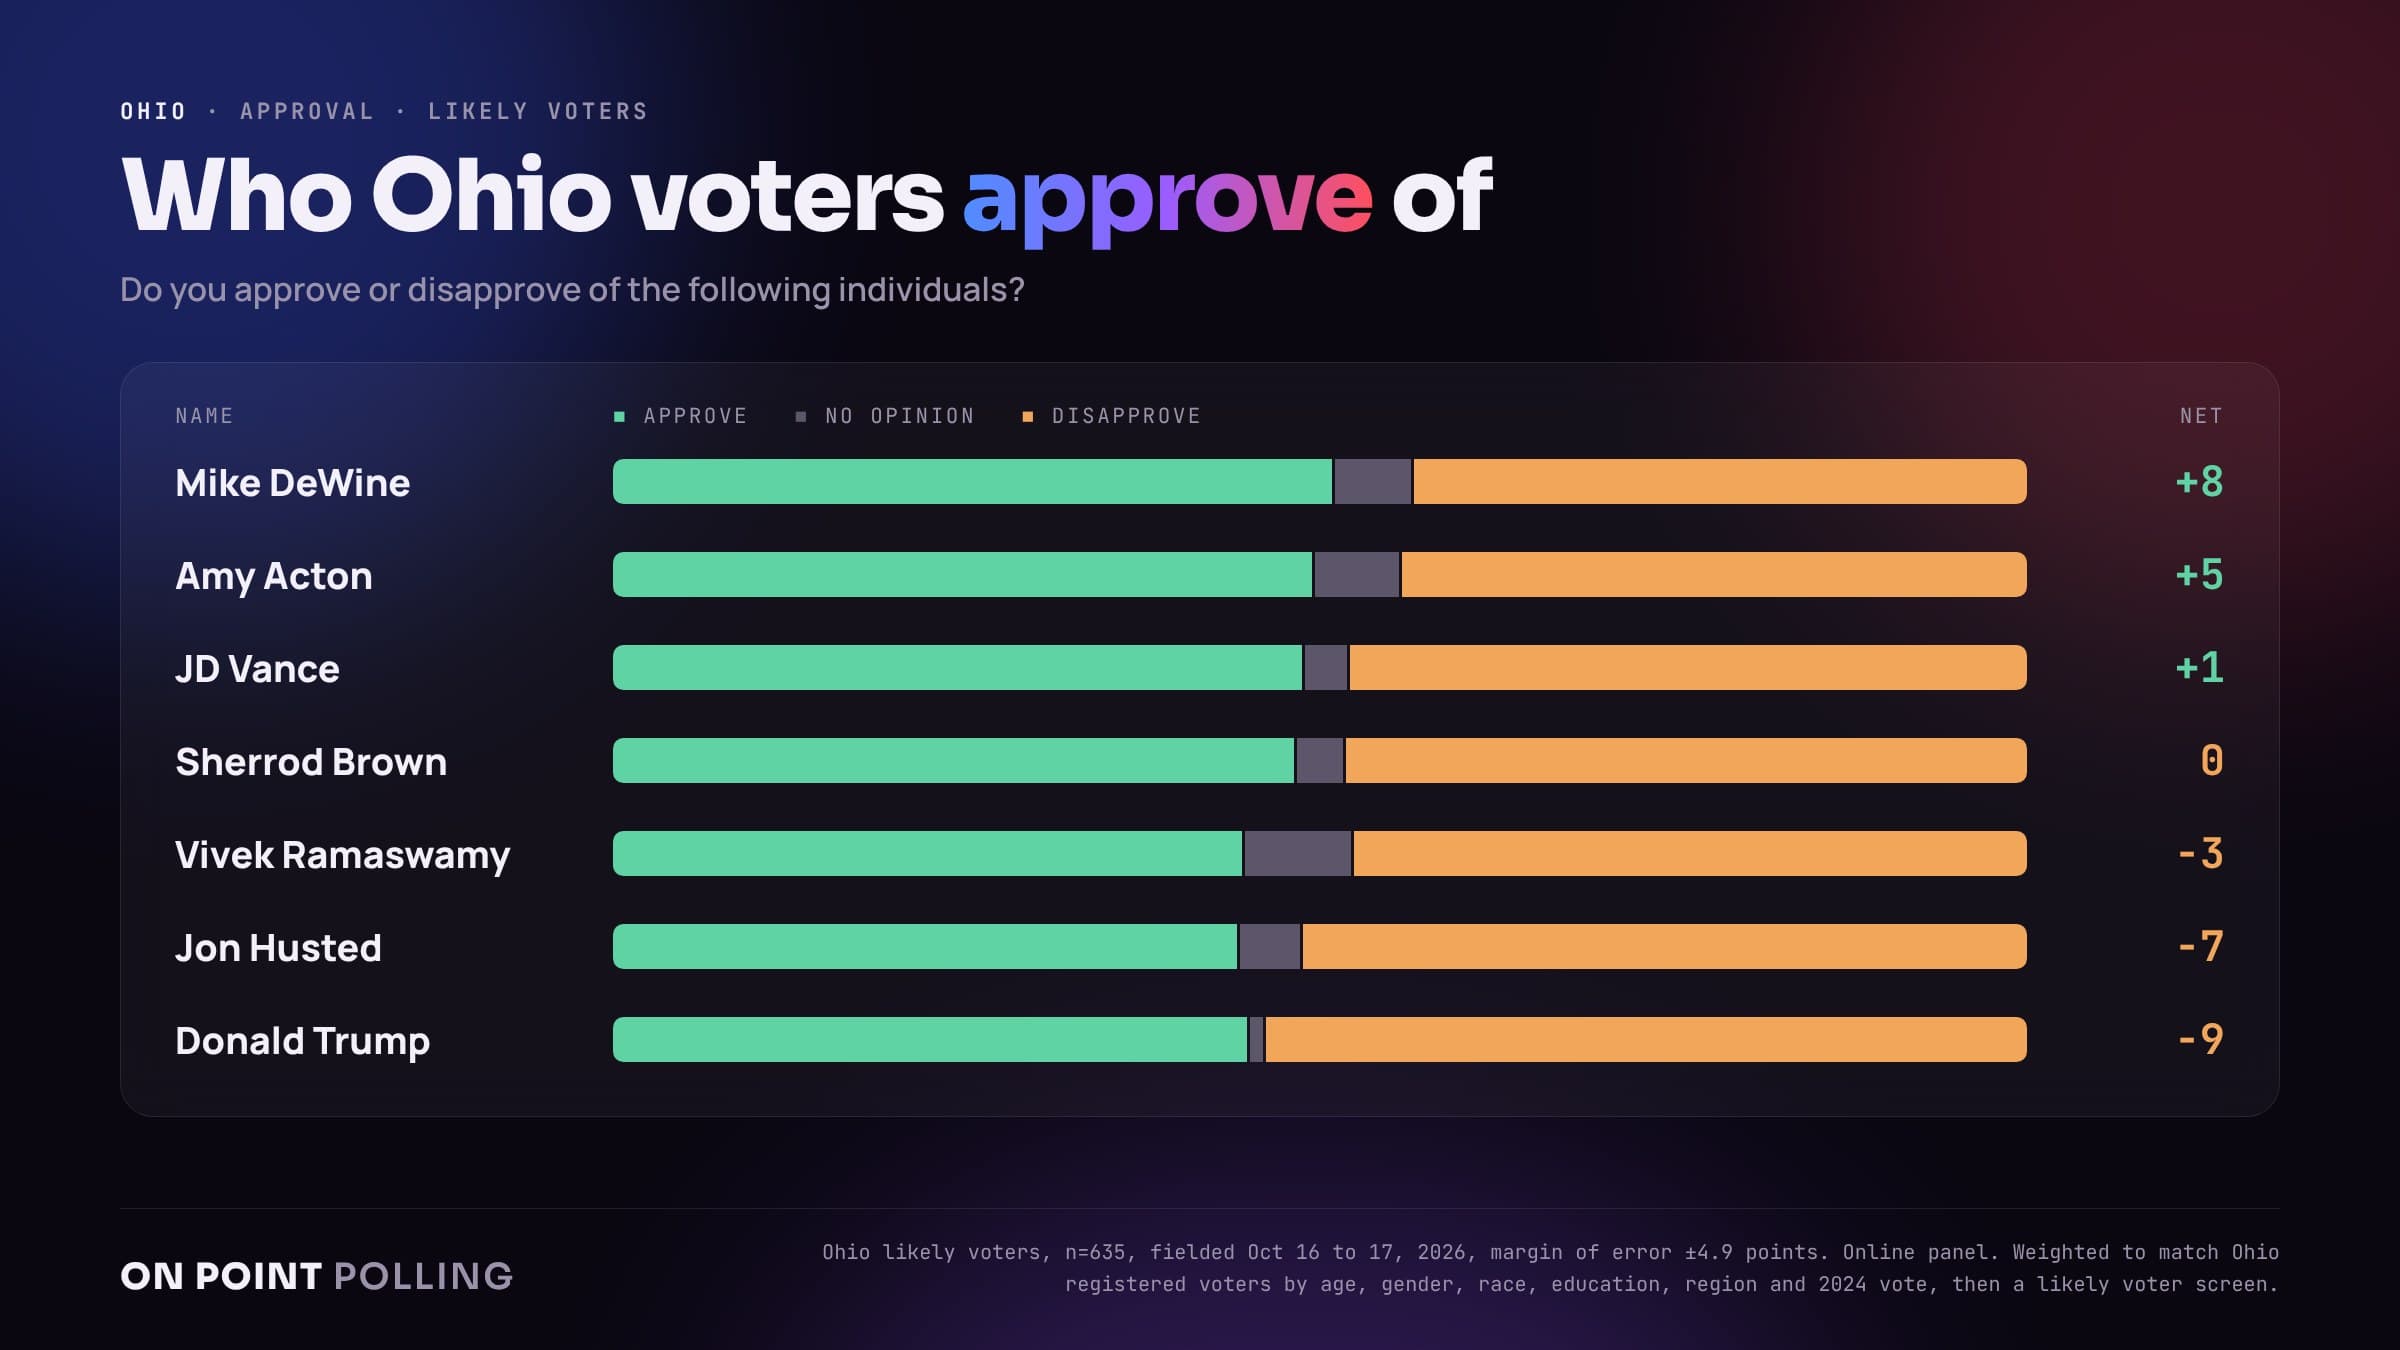
Acton is also the better known and better liked of the two. She is the only one of the four nominees with a net positive rating, 50% approve to 44% disapprove. Ramaswamy is at 45% to 48%, and 8% of likely voters have no opinion of him, the most of anyone we tested.
Among all registered voters, Acton leads by 4.9 points.
The early vote: Democrats are banking a lead
One in five Ohio likely voters says they have already cast a ballot, and that group backs the Democrats by nearly 40 points. Brown leads 66% to 29% among those who have voted, and Acton leads 68% to 30%.
Broken down by how Ohioans are voting, counting ballots already cast:
- By mail, 15% of likely voters. Brown 61%, Husted 36%. Acton 60%, Ramaswamy 34%. Three in four of these voters have already returned their ballot.
- Early in person, 16%. Brown 58%, Husted 35%. Acton 62%, Ramaswamy 35%. More than half have already voted.
- Election Day, 69%. Husted 45%, Brown 41%. Ramaswamy 47%, Acton 43%.
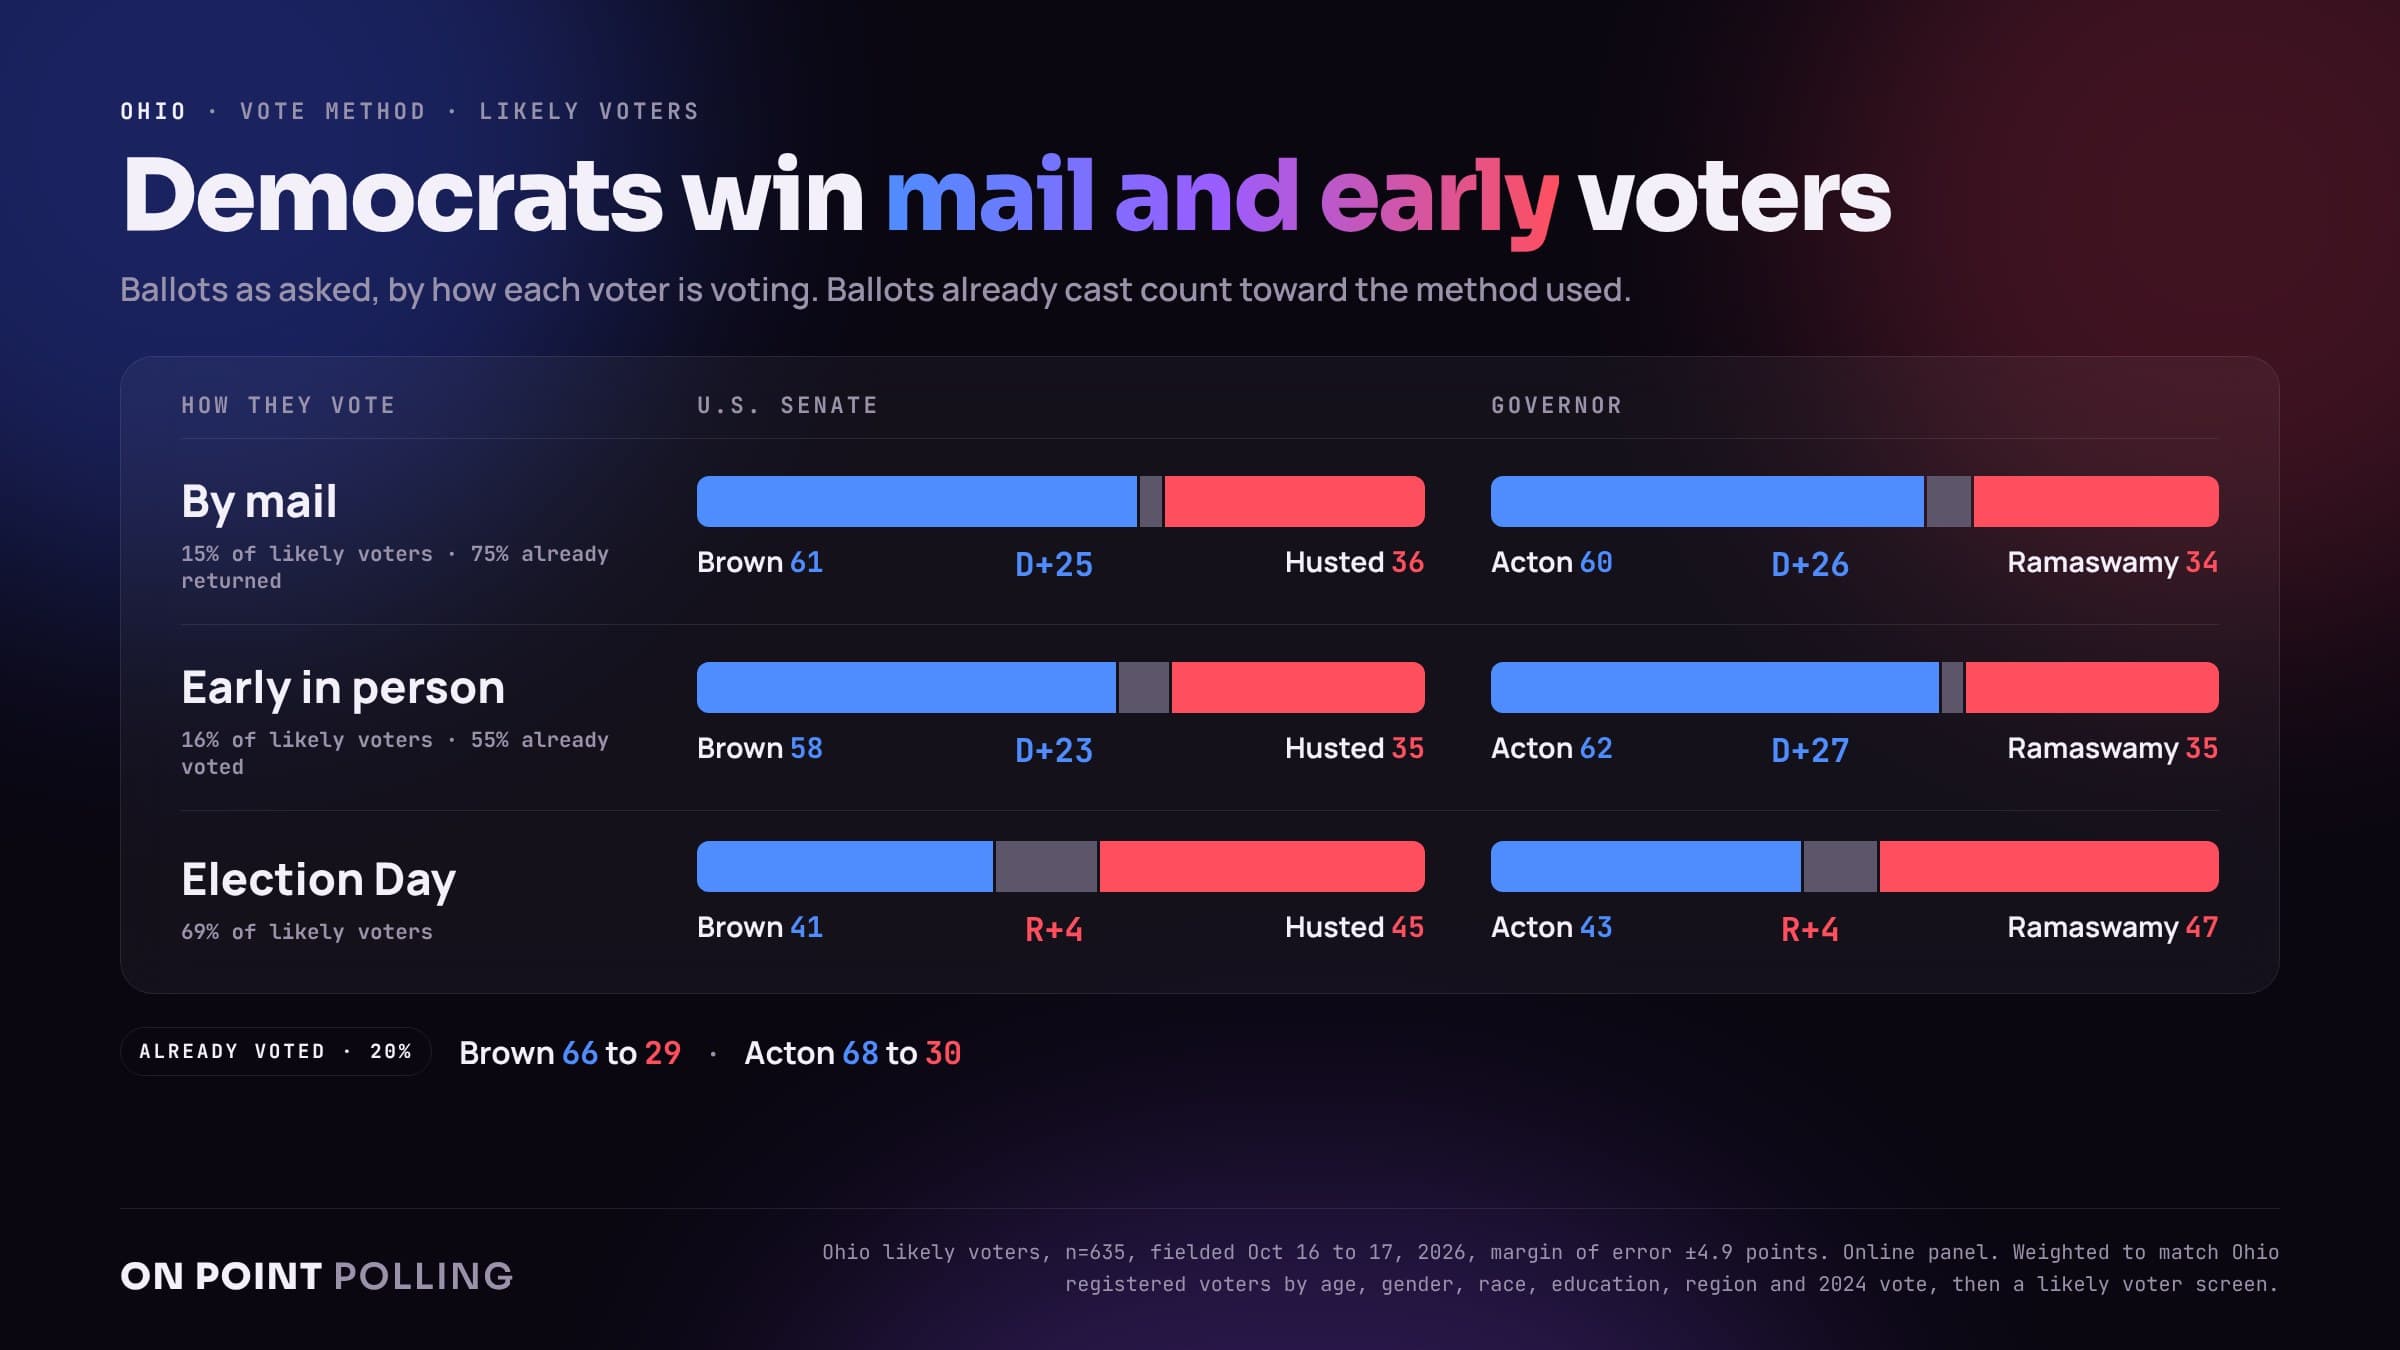
The Republicans win Election Day voters, but only by 4 points in both races. Among the 80% who have not voted yet, Husted leads 46% to 42% and Ramaswamy leads 46% to 43%.
That is the math Republicans have to solve. To overcome the votes Democrats have already banked, Husted and Ramaswamy need Election Day turnout that is both bigger and more lopsided than what we measure now.
Where the race is being decided
The suburbs are a dead heat, and that is where Ohio will be won. Voters in suburban ZIP codes, more than half the electorate, split 45% Husted to 44% Brown and 46% to 46% for governor.
The rest of the map looks like Ohio usually does:
- Cleveland area: Brown 51% to 36%. Acton 61% to 34%.
- North: Brown 55% to 35%. Acton 54% to 38%.
- Cincinnati and Dayton: Brown 49% to 41%. Acton 51% to 40%.
- Columbus area: Brown 44% to 41%. Acton and Ramaswamy tied at 42%.
- Ohio Valley: Husted 55% to 37%. Ramaswamy 62% to 37%.
- West: Husted 59% to 29%. Ramaswamy 59% to 29%.
By type of place, Democrats win city ZIP codes by more than 45 points, while Republicans win rural Ohio by 14 points for Senate and 16 for governor.
Trump, the candidates and the issues
President Trump is 9 points underwater in a state he carried comfortably. 45% of Ohio likely voters approve of his job performance and 54% disapprove, including 47% who strongly disapprove. He holds 85% of Republicans, but independents disapprove 68% to 29%.
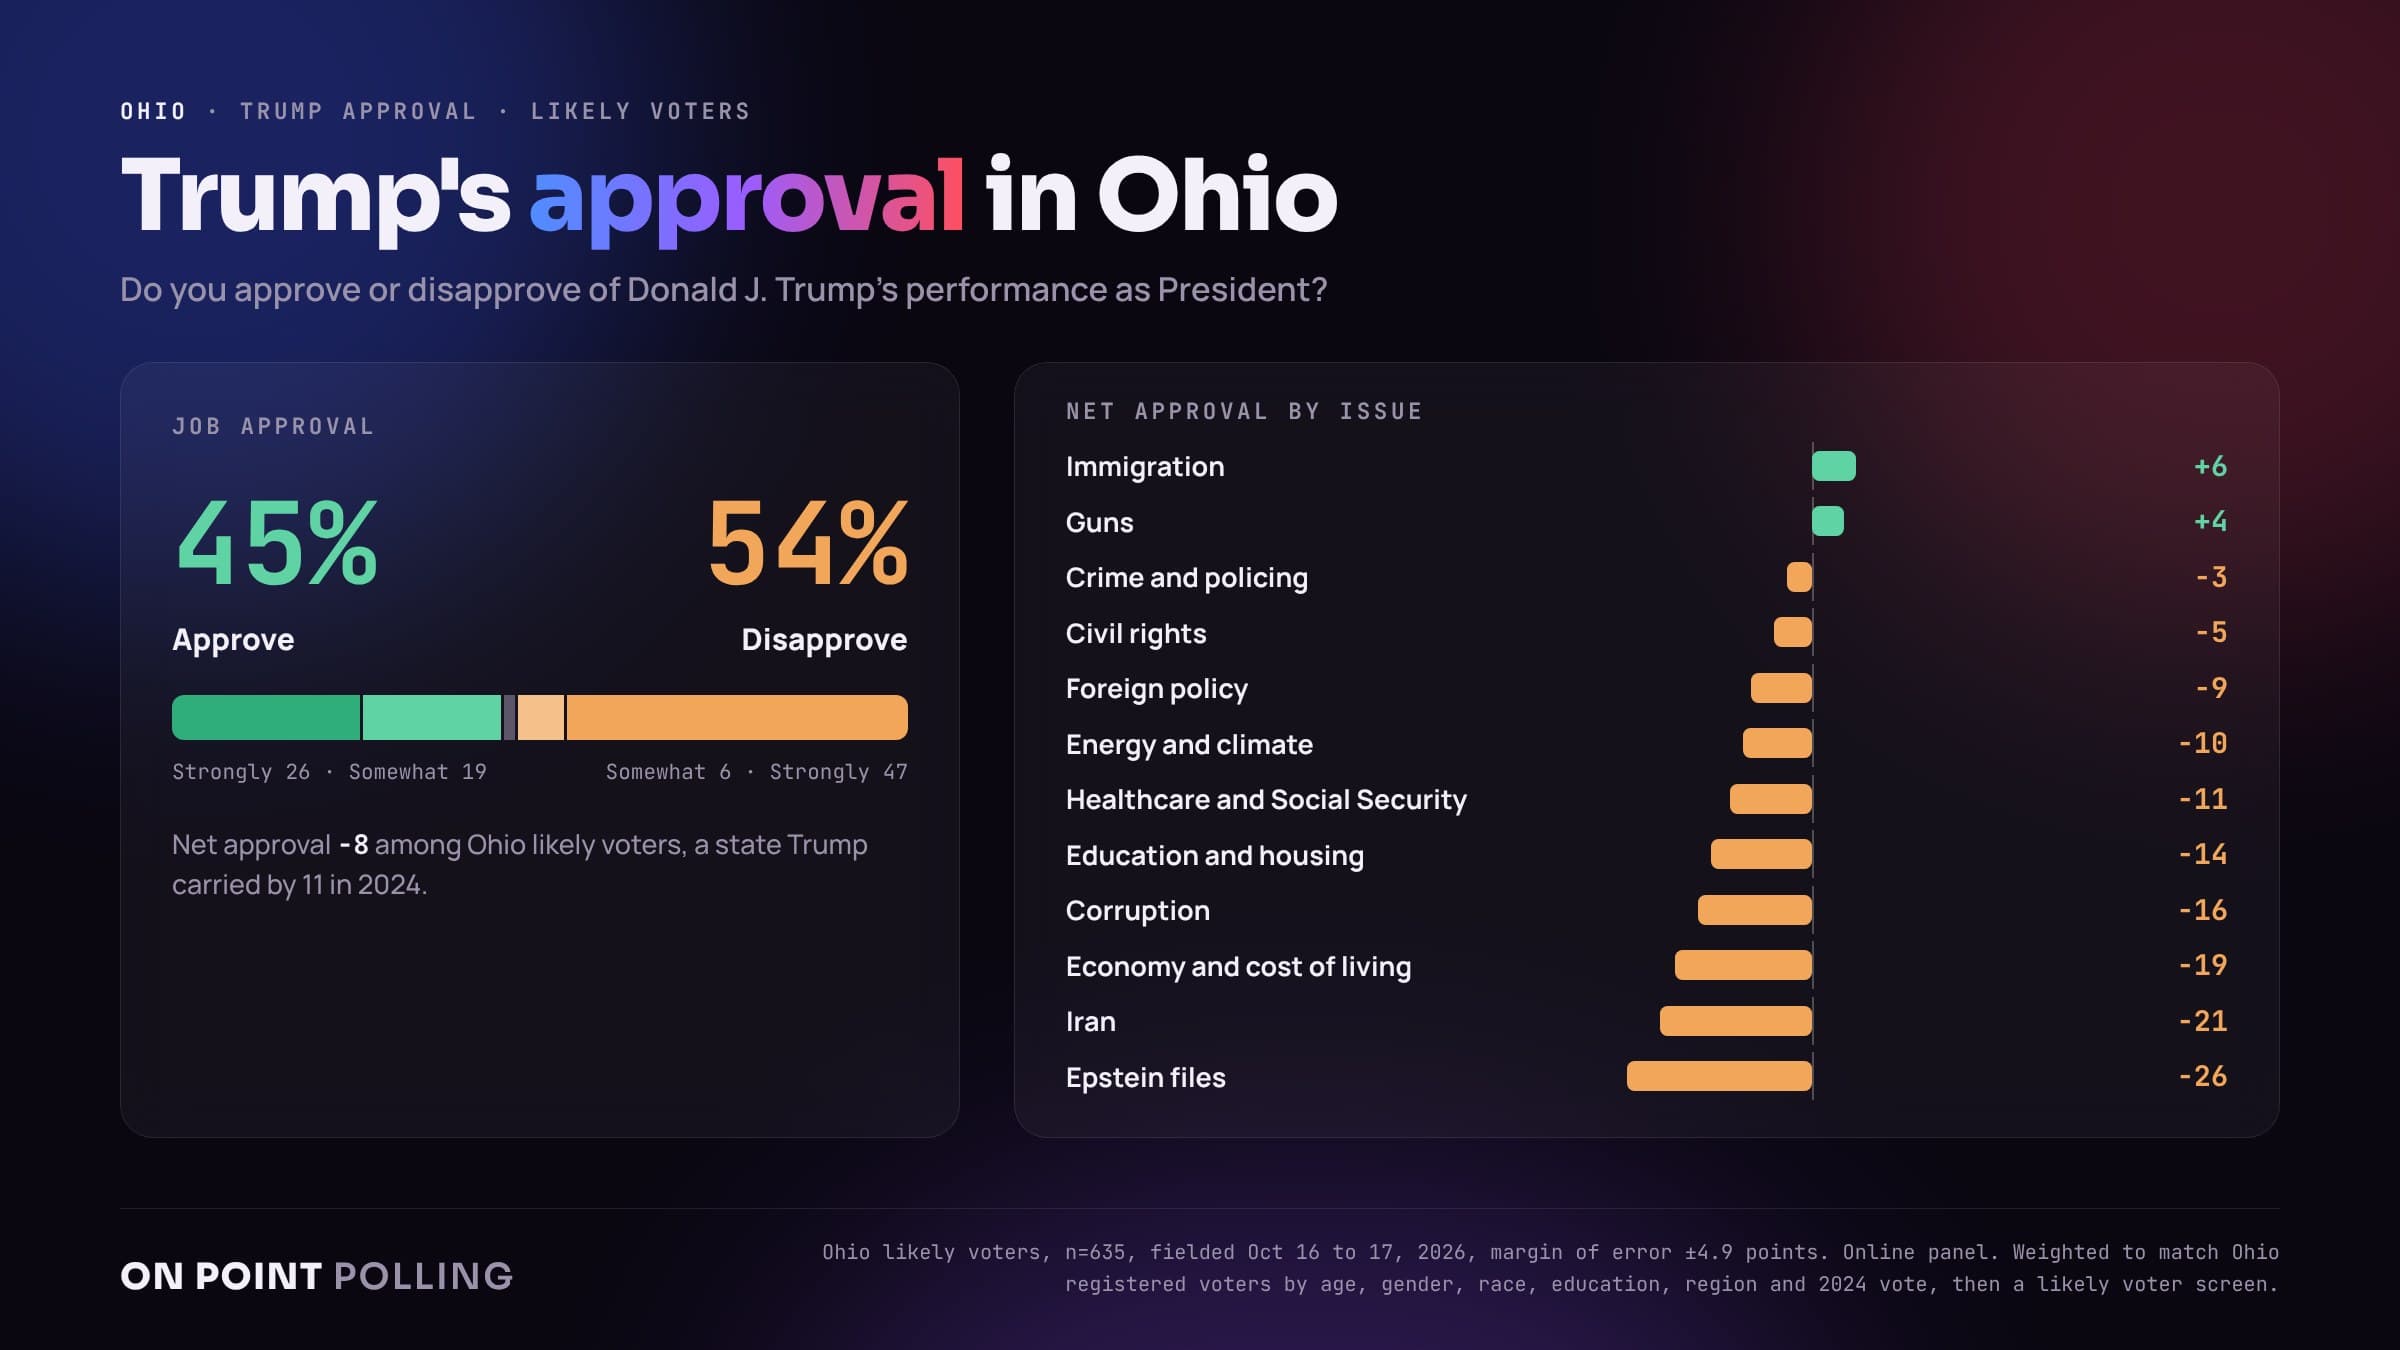
On the issues, Trump is above water on only 2 of the 12 we tested:
- Best: immigration and the border, +6, and guns and the Second Amendment, +5.
- Worst: the Epstein files, −25, Iran and Operation Epic Fury, −21, and the economy and cost of living, −19.
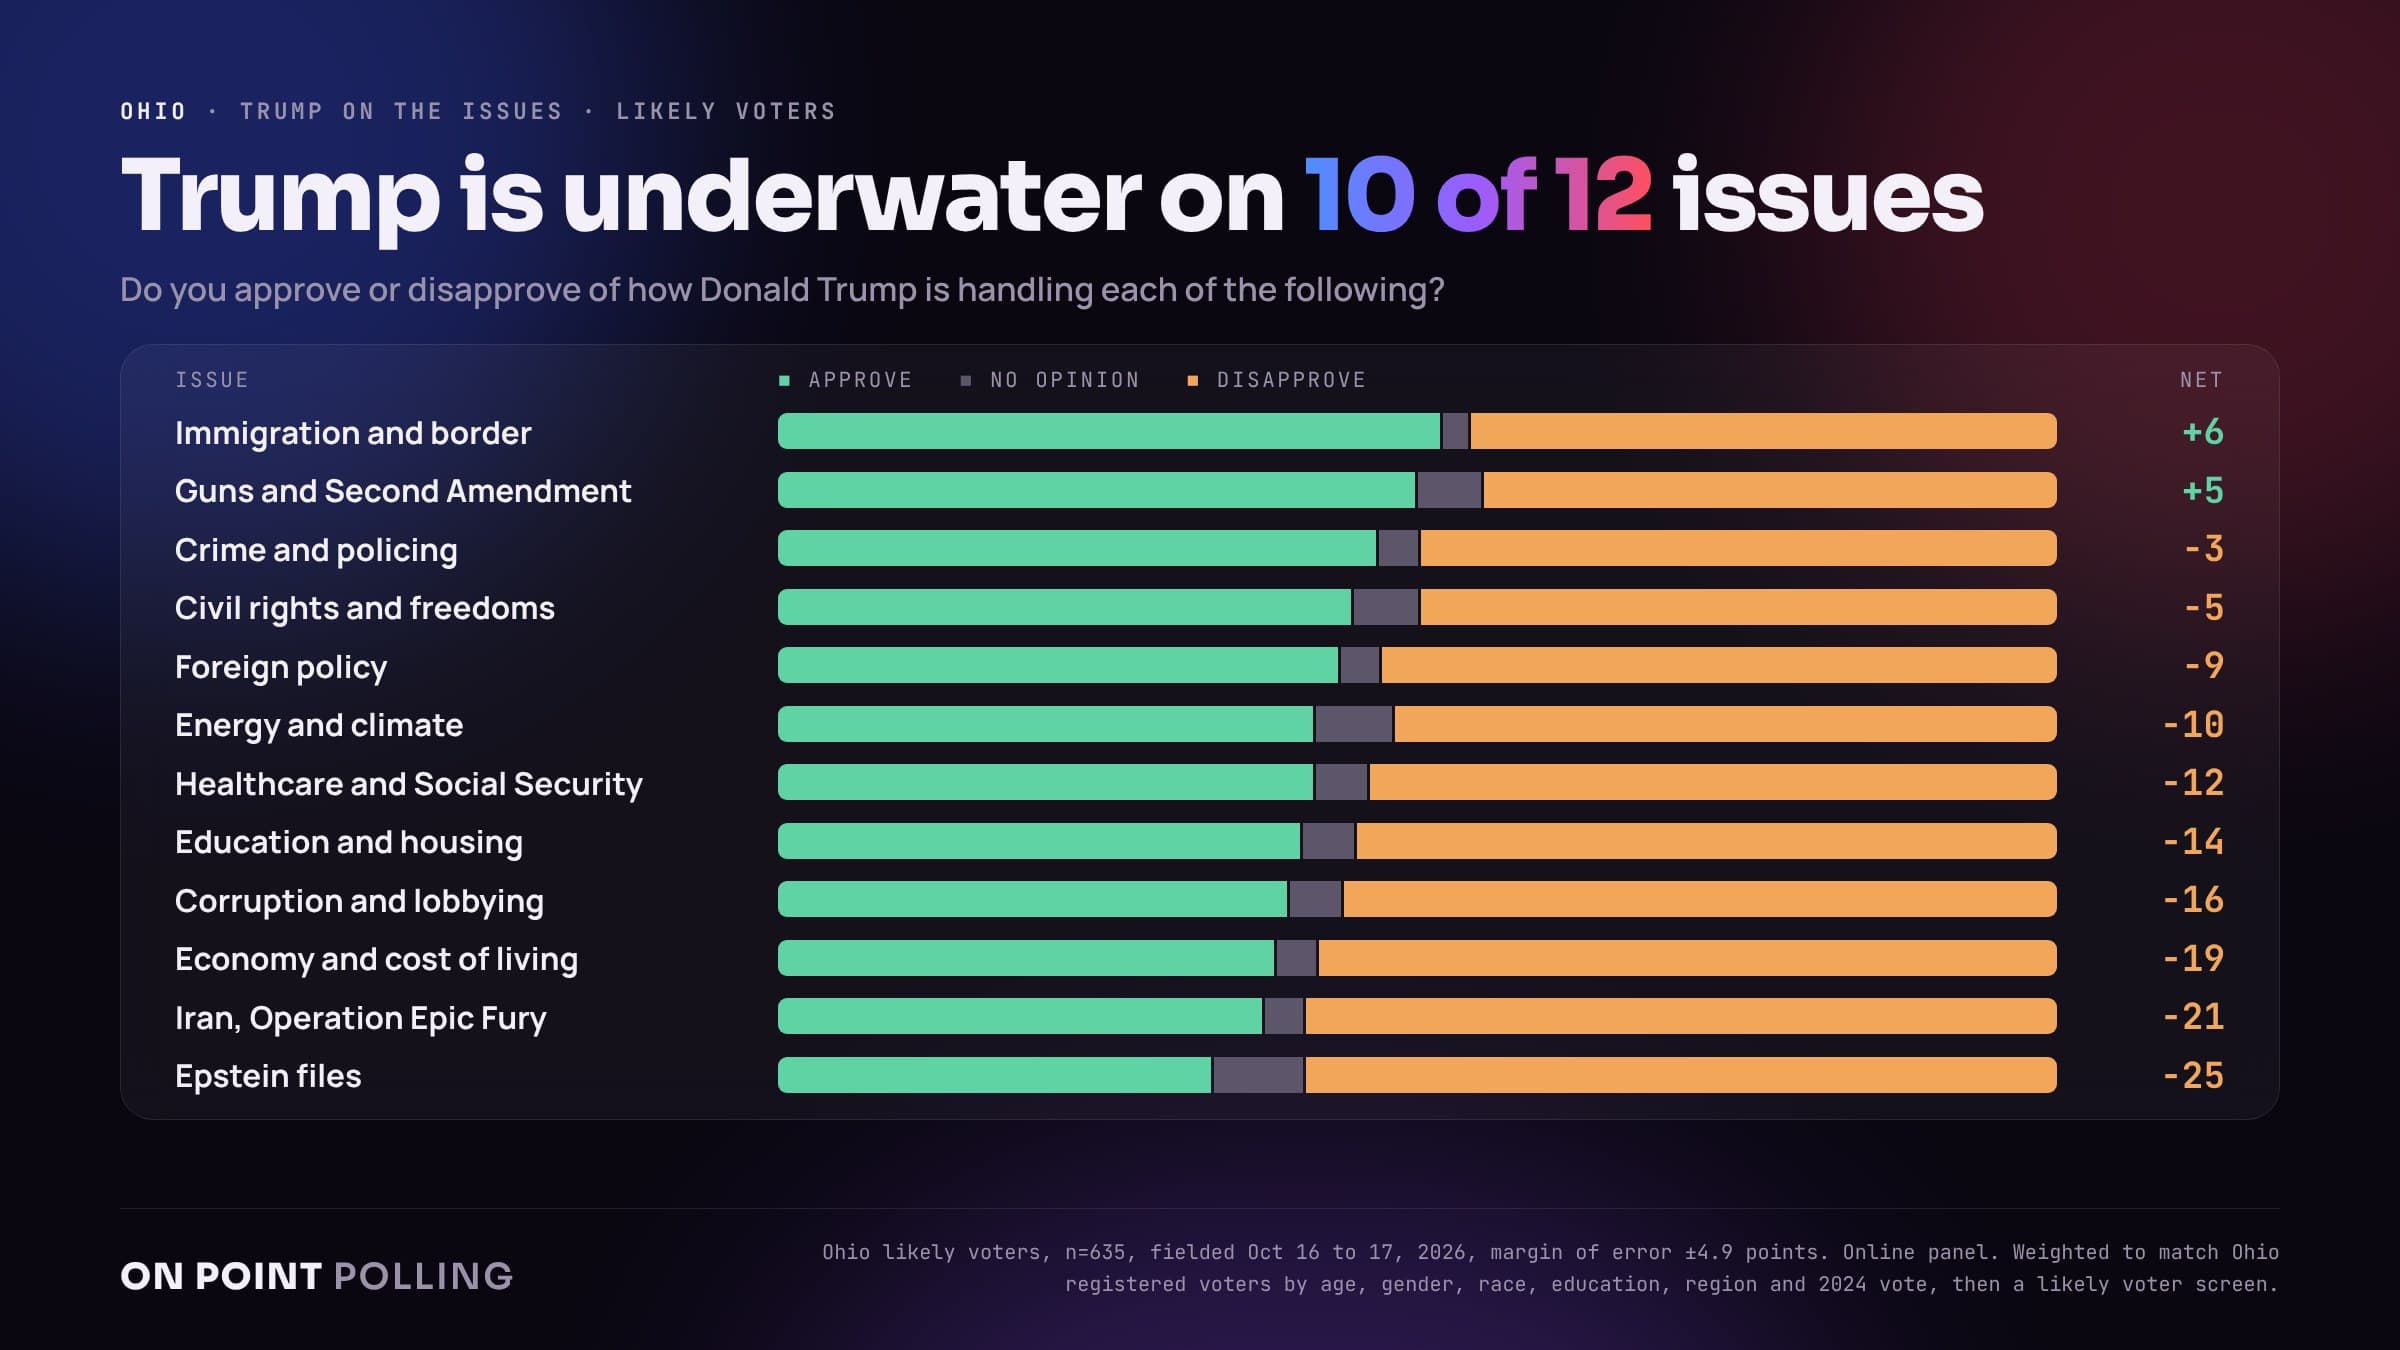
That last one matters most. The economy, jobs and cost of living is the top issue for 39% of likely voters, more than twice the next issue, healthcare and Social Security at 18%.
How Ohio rates the people on and around the ballot, by net approval:
Husted carries the weakest image of the four nominees, which helps explain why Brown leads despite Ohio's Republican lean.
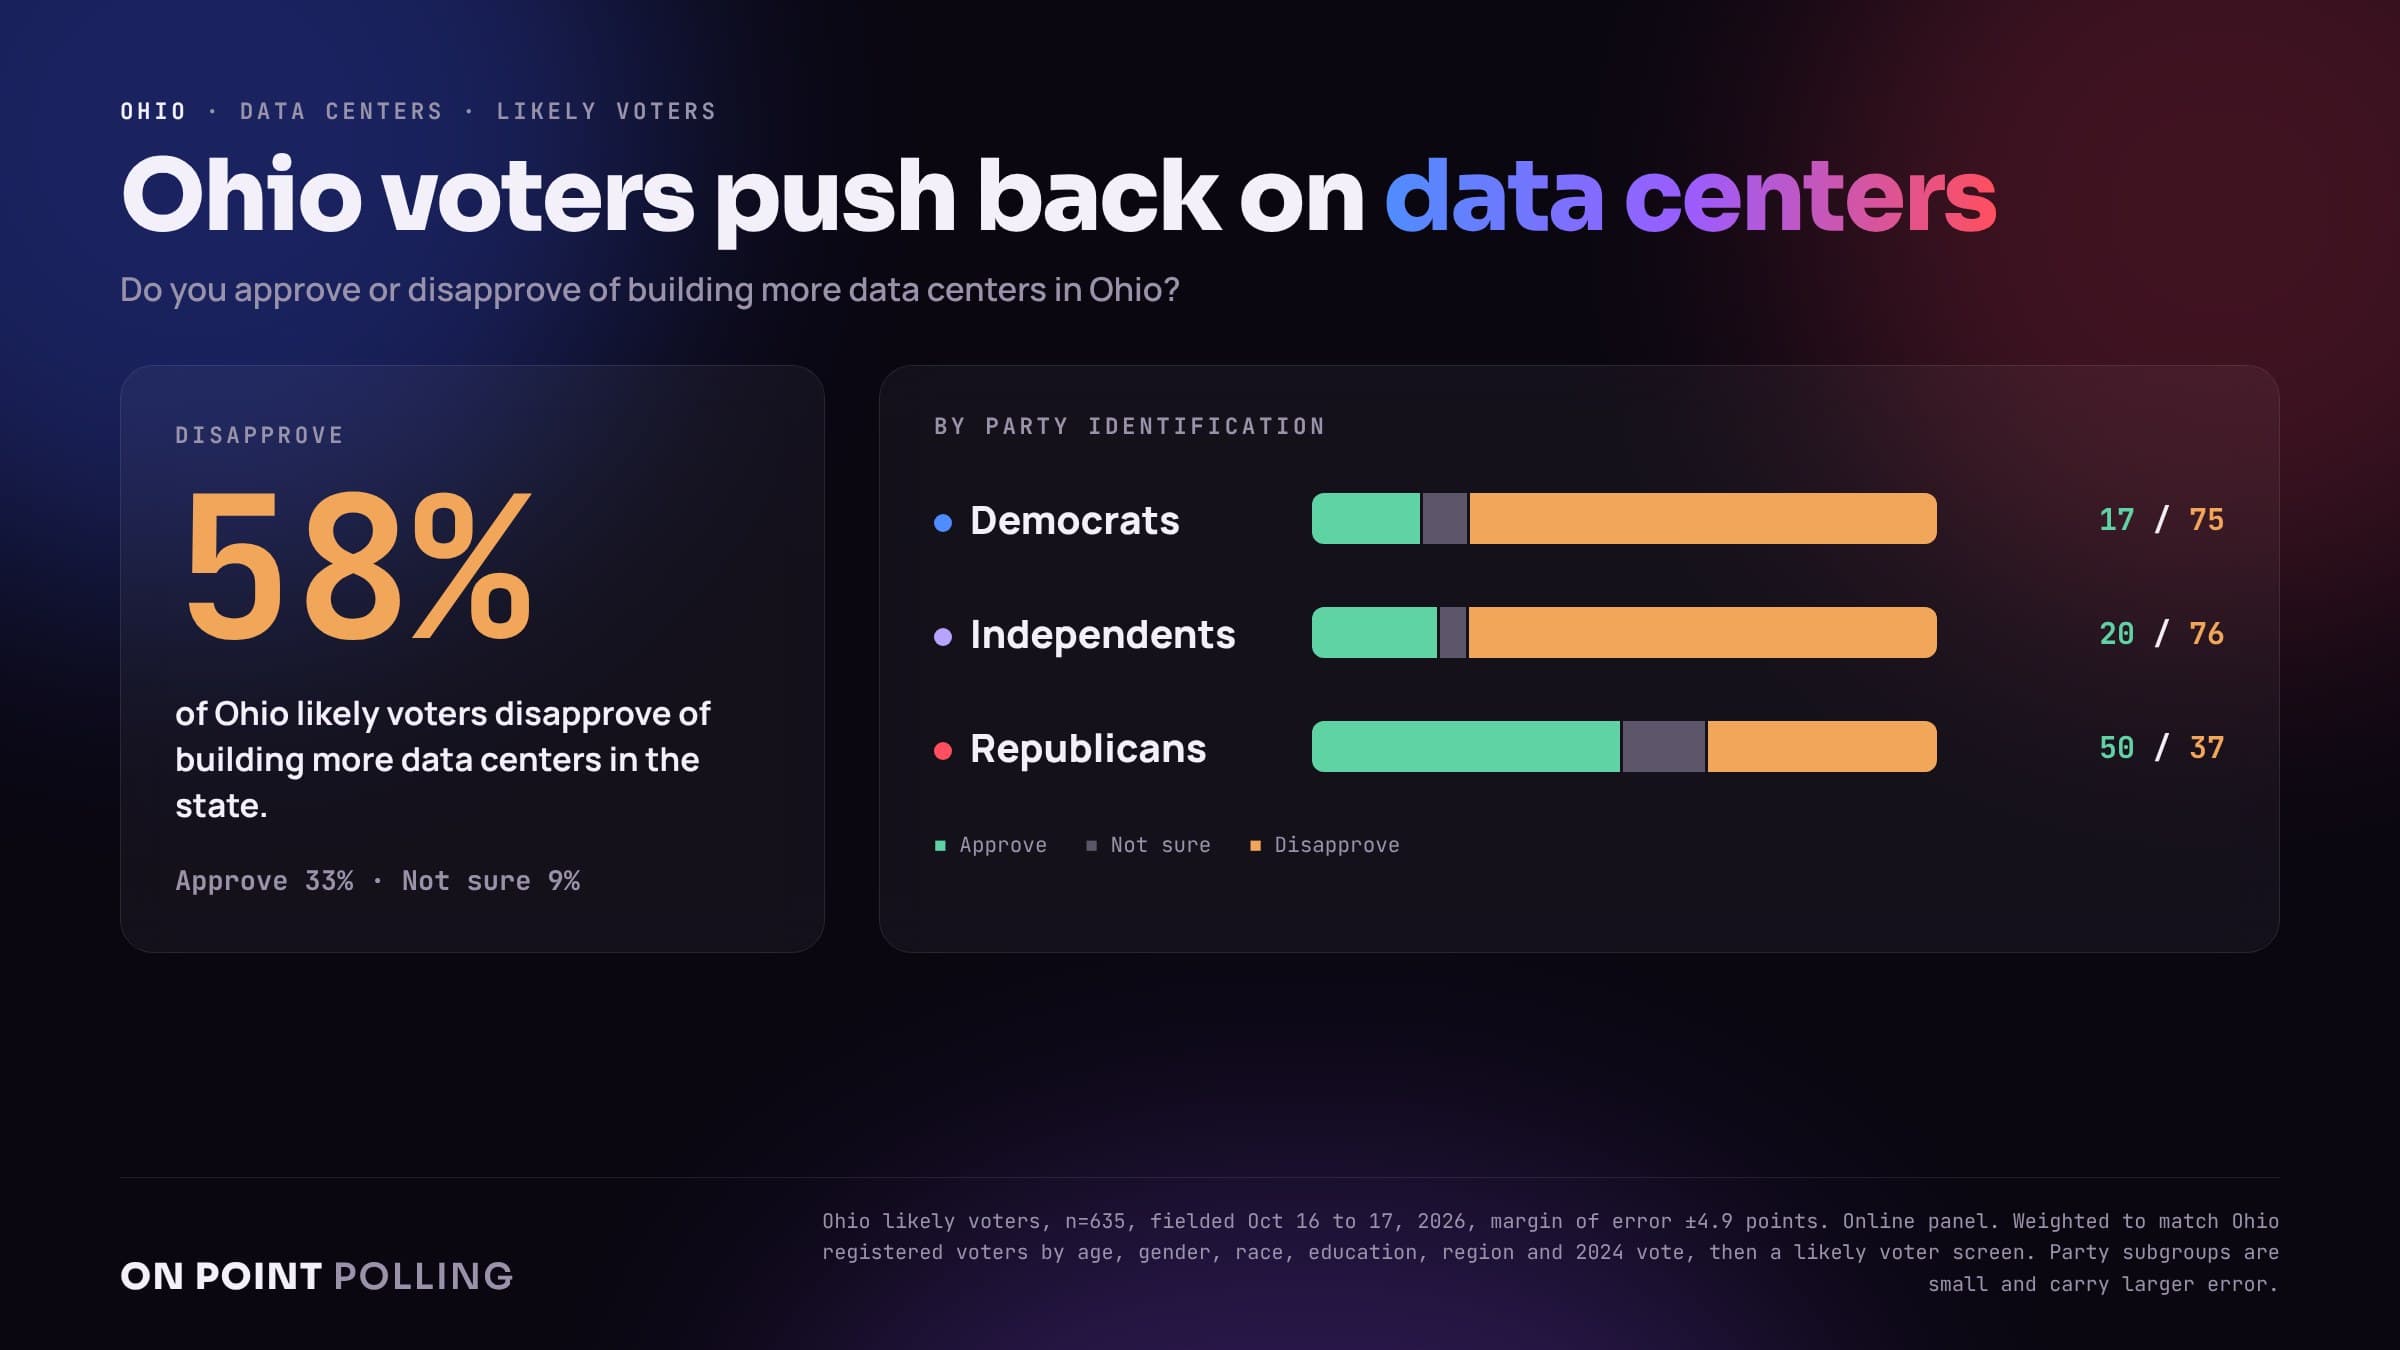
Data centers are a sleeper issue. 58% of likely voters disapprove of the large data centers being built across Ohio, and only 33% approve. Opposition is broad: 73% of independents, 68% of women and 59% of rural voters disapprove. Republicans are the only group where approval leads, 50% to 37%.
This is not a Democratic sample
The likely electorate in this poll leans Republican. 43.6% identify as Republicans, 36.0% as Democrats and 20.4% as independents, an R+7.6 electorate. They recall voting for Trump over Harris 52.9% to 43.8% in 2024, close to his actual 11 point win, even though we did not weight by recall vote.
So the Democratic leads are not a story about the sample. They are a story about independents breaking left, Republicans crossing over at higher rates than Democrats, and Democrats getting their voters to the polls early.
Turnout looks strong. 89% of likely voters say they are certain to vote, and our model implies turnout of about 66% of registered voters.
With 17 days to go, both races are within the margin of error. Ohio Republicans still have a path, but it runs through a big, lopsided Election Day, and right now Democrats are building a lead before that day arrives.